Water intelligence platform
Tracer Lab Water
Type a question about American water and get a real answer back — a map, a chart, the numbers, and where each of them came from.
Overview
Public water data, open to anyone
A farmer deciding what to plant, a city working out next summer's supply, a reporter checking a claim, someone buying land and wondering what the well will do — a lot of people need to know what water is doing, and the agencies already publish the answer. What they do not do is make it easy to get at. Finding the right numbers, lining them up and working out what they mean takes days and some practice.
This does that part. Ask in ordinary words, get an answer back with the map and the figures behind it, and keep going. Take it away as a document when you need to show it to someone.
Inside
What it looks like in use
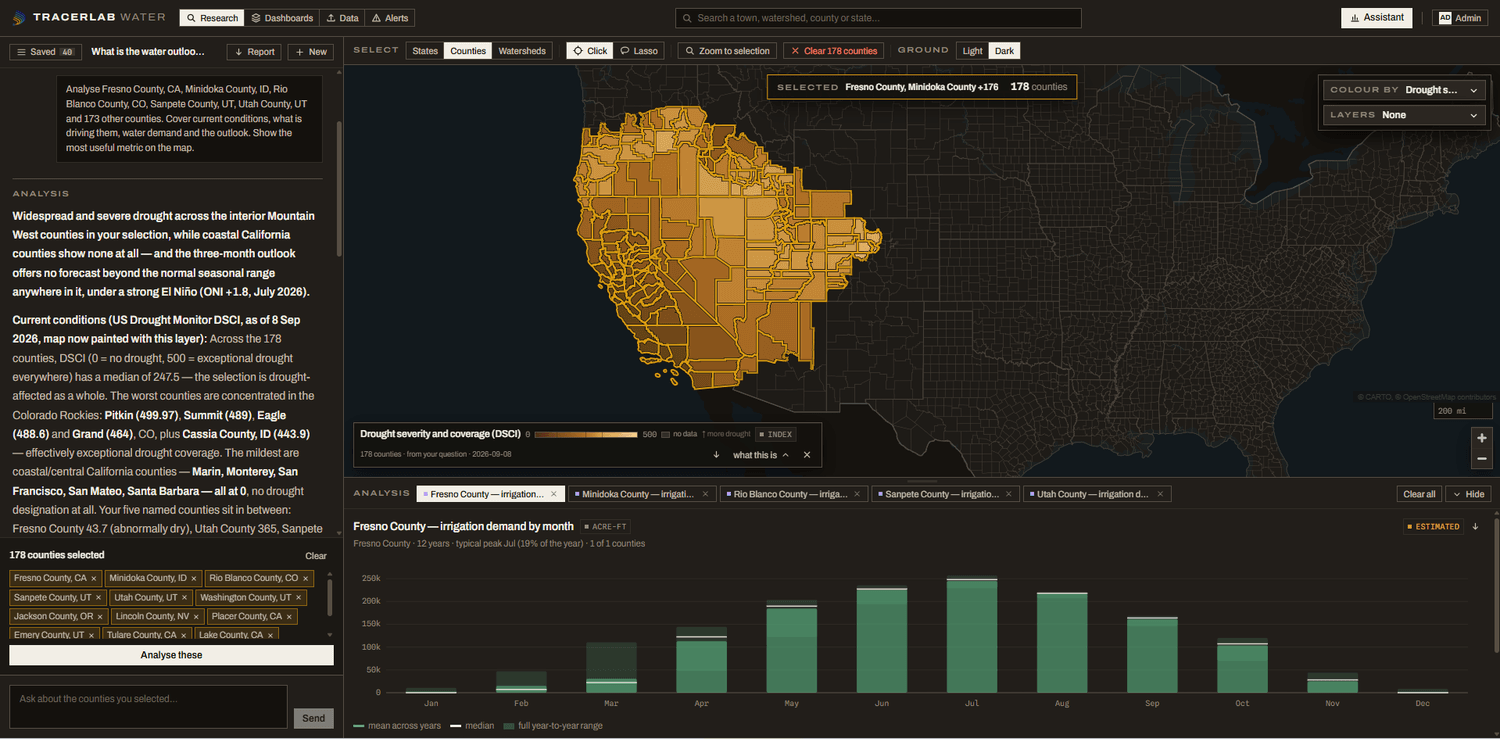
Ask about anything, anywhere
Water use and demand, drought, supply, snowpack, rights — ask about any of it, for whatever counties, basins or gauges you pick.
How it answers
Readings, forecasts and reporting, labelled apart
Every figure carries its source, its date and which of the three it is.
Instrument readings — stream gauges, wells, snow pillows, weather stations — carrying the date they were taken.
Forecasts and estimates from published models, labelled as such and kept separate from readings.
Rules, filings and news coverage, cited to where they were published and when.
Highlights
Why it's different
Ask, then keep asking
Pick the counties, basins or gauges you care about and ask about them. Follow-ups keep the selection, so you are refining a question rather than starting a new one.
It looks things up, too
Alongside the data it searches current reporting, agency notices and published rules, and cites what it finds with dates. Useful when the number alone does not explain what is going on.
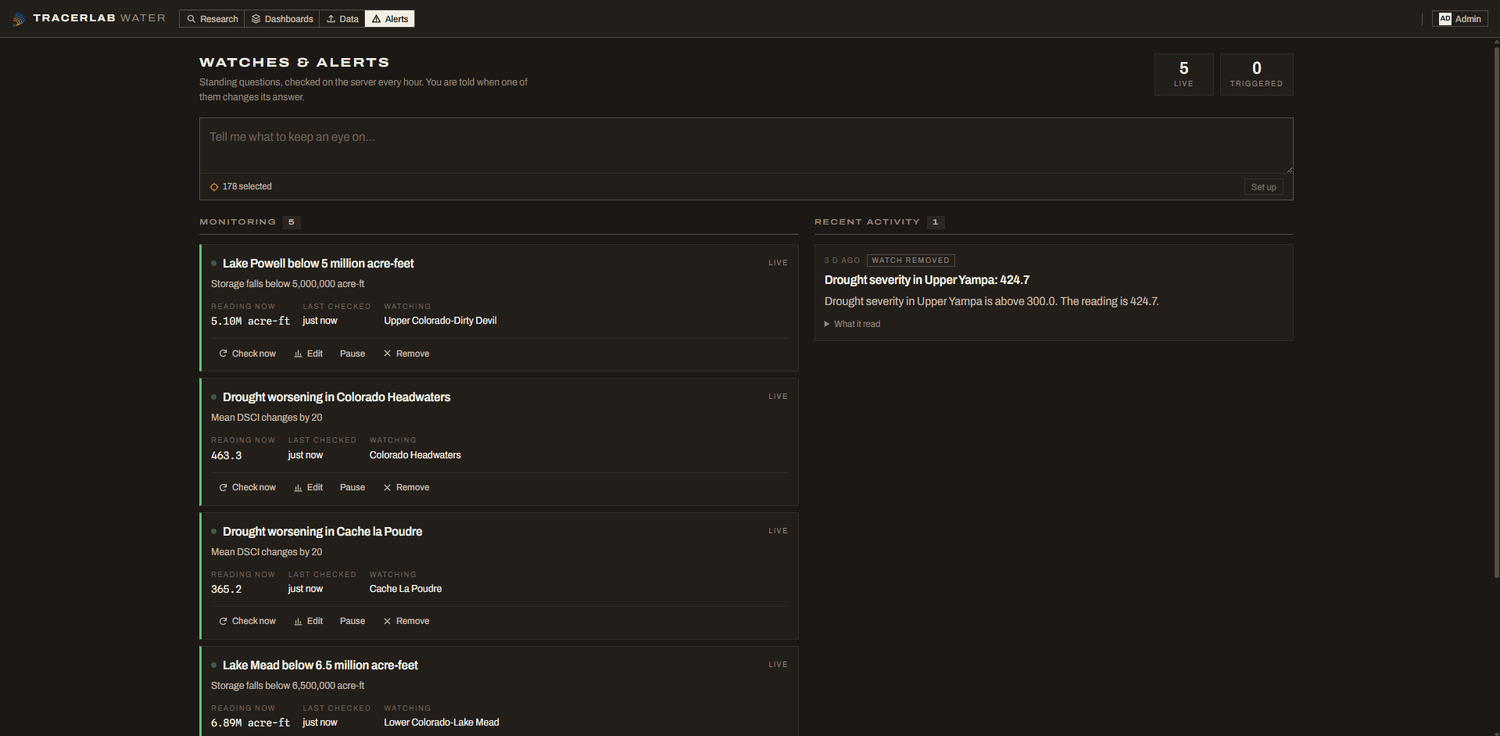
Every number carries its source
The agency that published it and the date it was current, on the figure. Measurements, model output and reporting are kept apart, so a forecast never reads as a reading.
Your own data alongside it
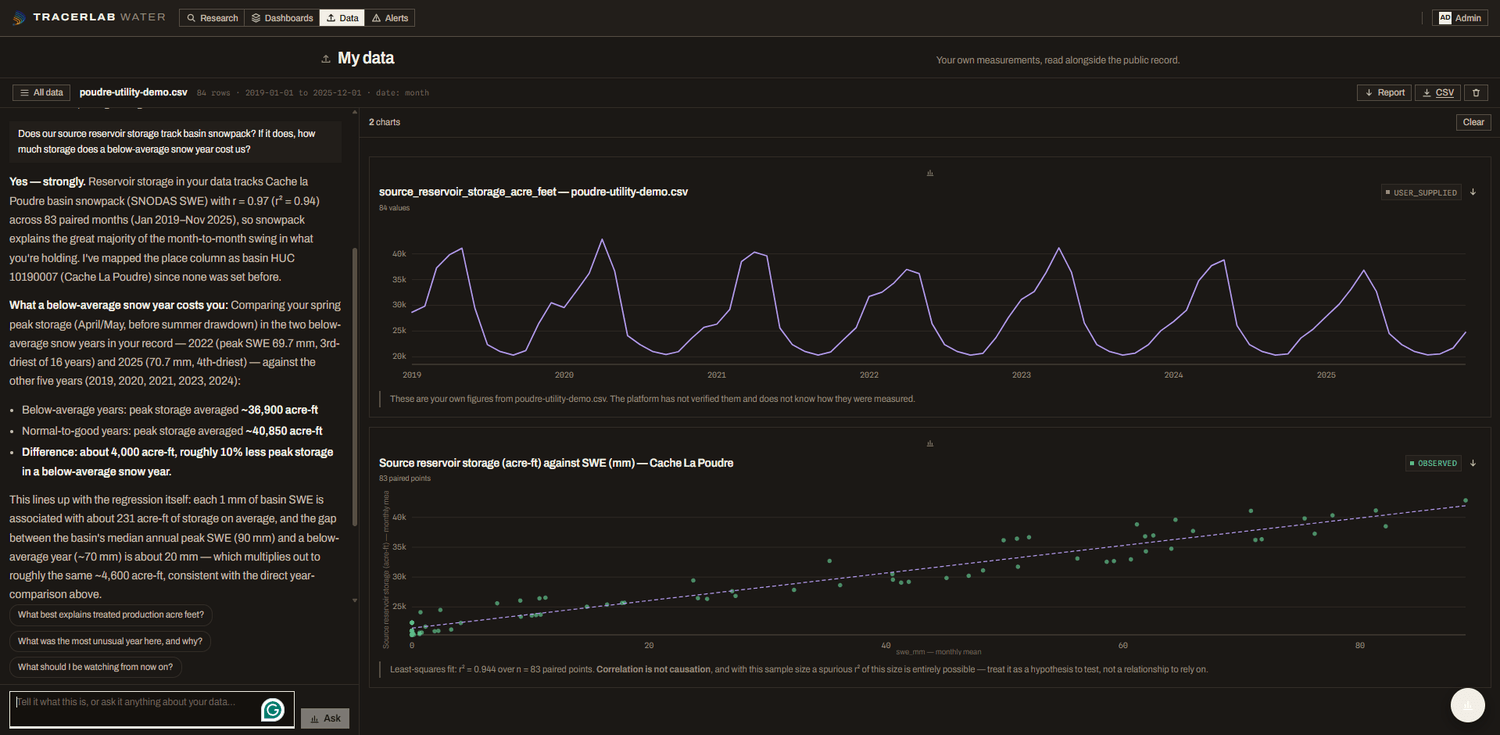
Load your measurements and compare them against the public record. Your figures stay labelled as yours, kept separate from the published data.
Ask for a dashboard, or a watch
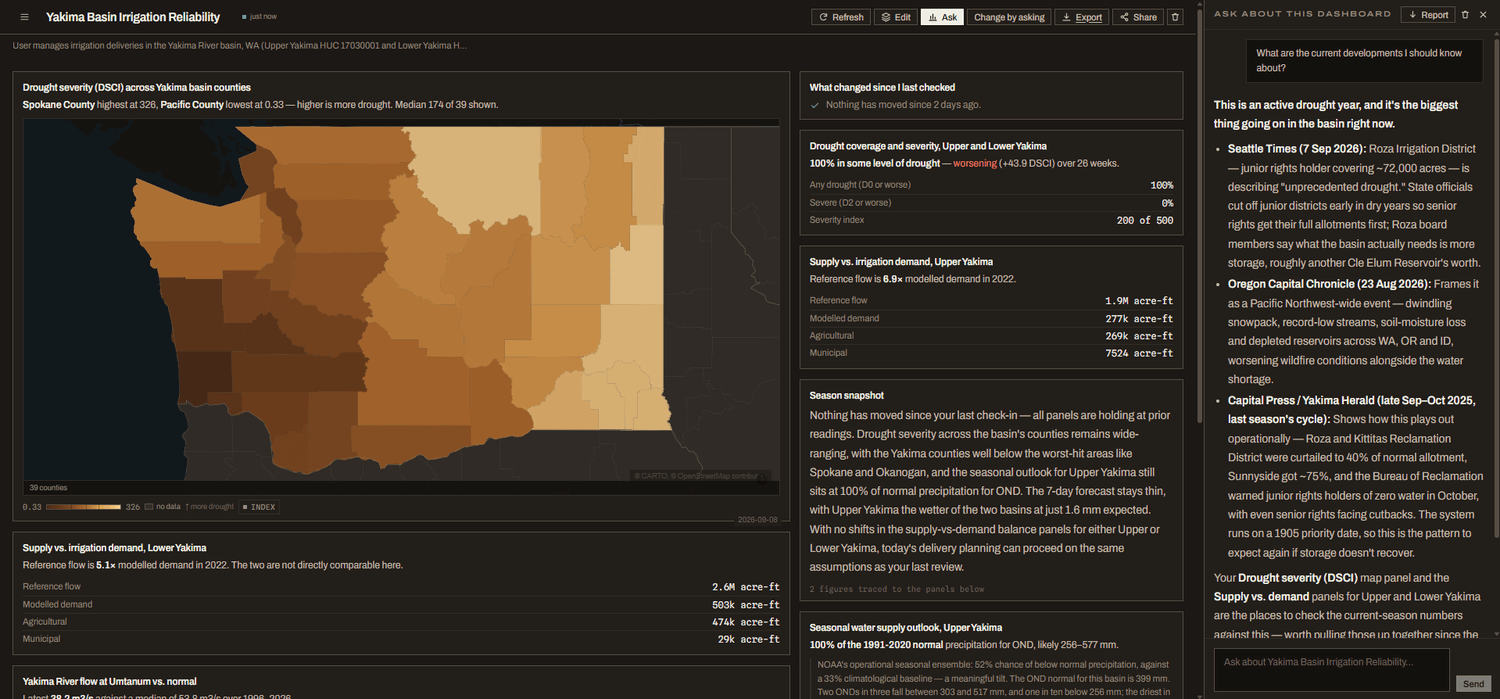
Describe a place you watch and the dashboard is built for you, holding its panels between visits and flagging what has moved. Set a line on a gauge and you hear when it is crossed.
It comes out as a document
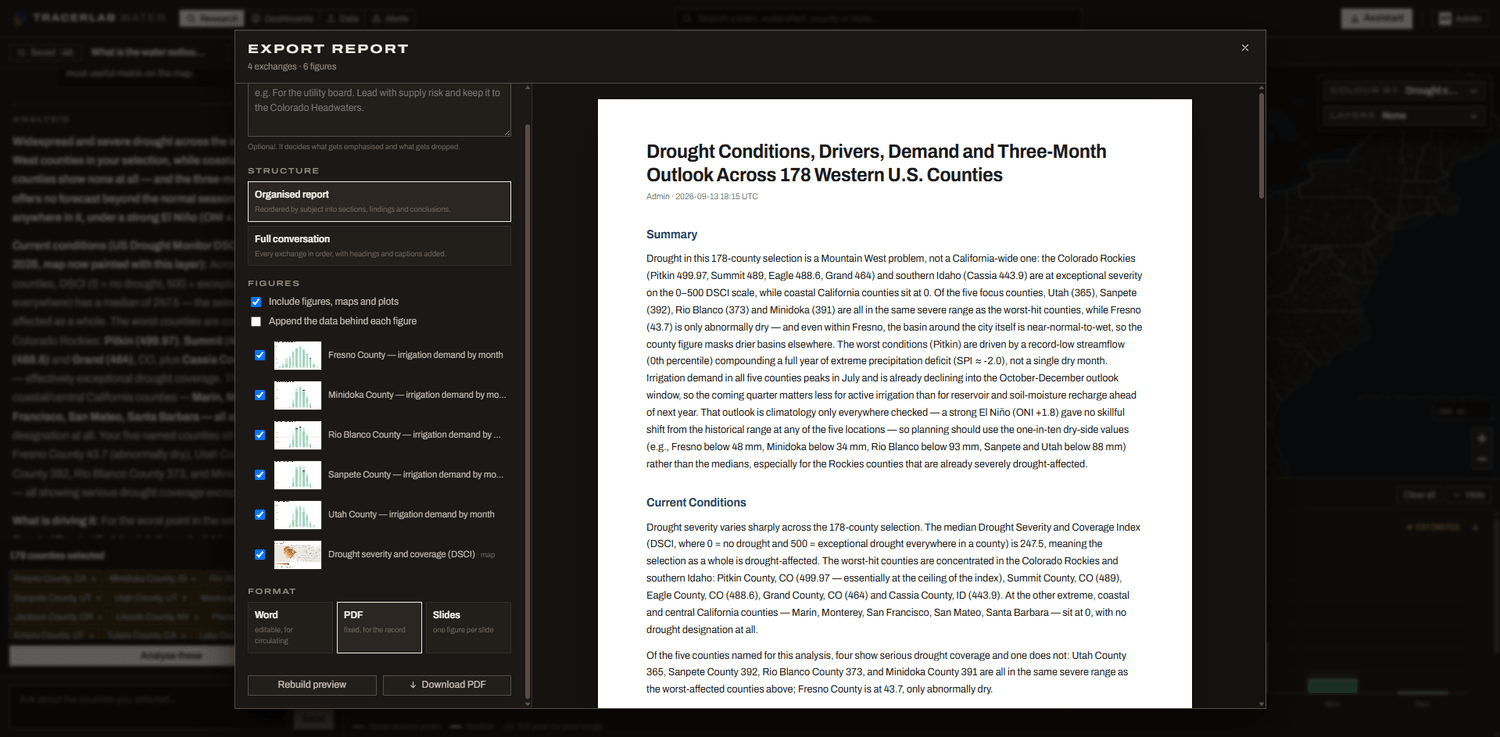
Say who it is for, choose the figures, and take it away as Word, a PDF or slides — with the numbers and the sources intact.
Where it comes from
Every source, named
These are the agencies the numbers come from. If yours is not here, ask — adding one is routine.
Streamflow & groundwater
- USGS stream gauges
- USGS groundwater
- National Water Prediction Service
- Corps of Engineers
- Bureau of Reclamation
Drought & climate
- US Drought Monitor
- PRISM
- Daymet
- CHIRPS
- NOAA station records
- Climate indices
Snow
- SNOTEL
- SNODAS
- NRCS water-supply forecasts
Forecasts
- HRRR
- GFS
- Seasonal outlooks
- Radar-based precipitation
Use, rights & markets
- USGS water use
- Irrigation withdrawals
- Colorado water rights
- Kansas water rights
- North Dakota permits
- Texas Water Development Board
- California DWR
Quality & infrastructure
- Water Quality Portal
- Safe Drinking Water Act records
- Drinking water rules
- National Inventory of Dams
- OpenET
- USDA agricultural statistics
- Census
And more…
Specifications
The shape of it
The platform
| Delivery | Hosted — nothing to install |
| Access | Named accounts, by invitation |
| Geography | Counties, states, watersheds, gauge sites |
| Coverage | United States |
| Views | Research, Dashboards, Data, Alerts |
| Takeaway | Word, PDF, slides, or the data itself |
The data
| Sources | Federal and state, taken from the publisher |
| Updates | Hourly to yearly, depending on the source |
| Currency | Shown per source, so you can see what is behind |
| Your data | Spreadsheets, kept separate and labelled as yours |
| Labelling | Measured, modeled and reported, never mixed |
Request a demo
See it against your own question
Demos are run live, not recorded. Bring something you actually want to know — a basin, a county, a crop, a property, a claim you want checked — and we will put it to the platform while you watch. If the data to answer it is not there, we will say so.